

What is Syslog?
Syslog stands for System Logging Protocol and is a standard protocol used to send system log or event messages to a specific server, called a syslog server. It is primarily used to collect various device logs from several different machines in a central location for monitoring and review.
Syslog
The protocol is enabled on most network equipment such as routers, switches, firewalls, and even some printers and scanners. In addition, syslog is available on Unix and Linux based systems and many web servers including Apache. Syslog is not installed by default on Windows systems, which use their own Windows Event Log. These events can be forwarded via third-party utilities or other configurations using the syslog protocol.
Syslog is defined in RFC 5424, The Syslog Protocol, which obsoleted the previous RFC 3164.
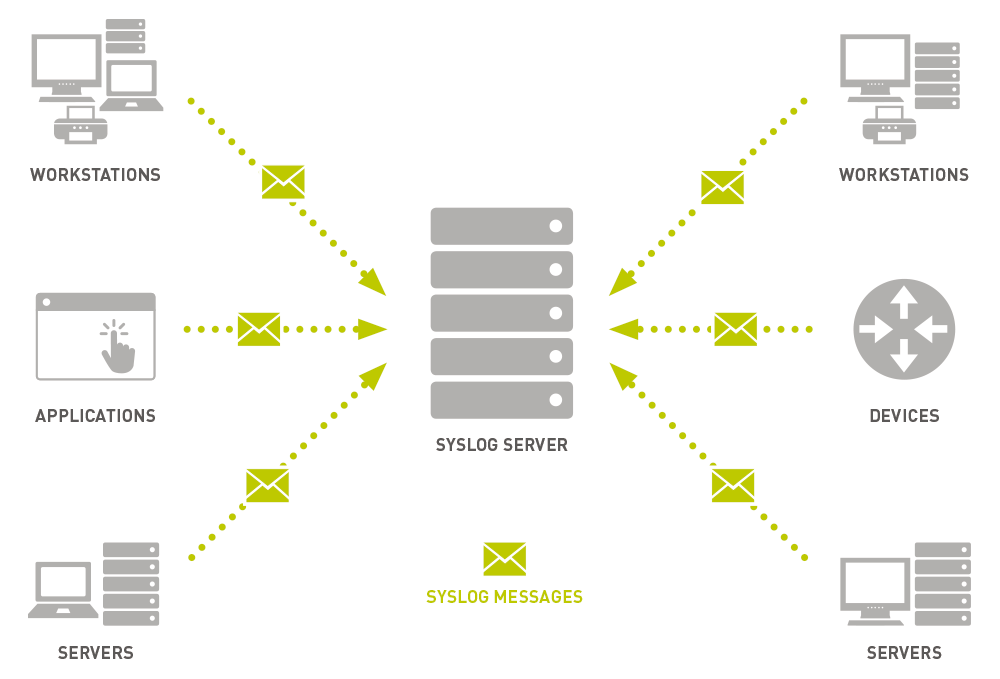
Syslog Components
On any given device various events are generated by the system in response to changing conditions. These events are typically logged locally where they can be reviewed and analyzed by an administrator. However, monitoring numerous logs over an equally numerous number of routers, switches, and systems would be time consuming and impractical. Syslog helps solve this issue by forwarding those events to a centralized server.
Syslog Transmission
Traditionally, Syslog uses the UDP protocol on port 514 but can be configured to use any port. In addition, some devices will use TCP 1468 to send syslog data to get confirmed message delivery.
Syslog packet transmission is asynchronous. What causes a syslog message to be generated is configured within the router, switch, or server itself. Unlike other monitoring protocols, such as SNMP, there is no mechanism to poll the syslog data. In some implementations, SNMP may be used to set or modify syslog parameters remotely.
he syslog message consists of three parts: PRI (a calculated priority value), HEADER (with identifying information), and MSG (the message itself).
The PRI data sent via the syslog protocol comes from two numeric values that help categorize the message. The first is the Facility value. This value is one of 15 predefined values or various locally defined values in the case of 16 to 23. These values categorize the type of message or which system generated the event.
| Number | Facility description |
| 0 | Kernel messages |
| 1 | User-level messages |
| 2 | Mail System |
| 3 | System Daemons |
| 4 | Security/Authorization Messages |
| 5 | Messages generated by syslogd |
| 6 | Line Printer Subsystem |
| 7 | Network News Subsystem |
| 8 | UUCP Subsystem |
| 9 | Clock Daemon |
| 10 | Security/Authorization Messages |
| 11 | FTP Daemon |
| 12 | NTP Subsystem |
| 13 | Log Audit |
| 14 | Log Alert |
| 15 | Clock Daemon |
| 16 - 23 | Local Use 0 - 7 |
The second label of a syslog message categorizes the importance or severity of the message in a numerical code from 0 to 7.
| Code | Severity | Description |
| 0 | Emergency | System is unusable |
| 1 | Alert | Action must be taken immediately |
| 2 | Critical | Critical conditions |
| 3 | Error | Error conditions |
| 4 | Warning | Warning conditions |
| 5 | Notice | Normal but significant condition |
| 6 | Informational | Informational messages |
| 7 | Debug | Debug-level messages |
The values of both labels do not have hard definitions. Thus, it is up to the system or application to determine how to log an event (for example, as a warning, notice, or something else) and on which facility. Within the same application or service, lower numbers should correspond to more severe issues relative to the specific process.
The two values are combined to produce a Priority Value sent with the message. The Priority Value is calculated by multiplying the Facility value by eight and then adding the Severity Value to the result. The lower the PRI, the higher the priority.
(Facility Value * 8) + Severity Value = PRI
In this way, a kernel message receives lower value (higher priority) than a log alert, regardless of the severity of the log alert. Additional identifiers in the packet include the hostname, IP address, process ID, app name, and timestamp of the message.
The actual verbiage or content of the syslog message is not defined by the protocol. Some messages are simple, readable text, others may only be machine readable.
Syslog messages are typically no longer than 1024 bytes.
<165>1 2003-10-11T22:14:15.003Z mymachine.example.com - ID47 [exampleSDID@32473 iut="3" eventSource=" eventID="1011"] BOMAn application log entry...
Parts of the Syslog Message:
| Part | Value | Information |
| PRI | 165 | Facility = 20, Severity = 5 |
| VERSION | 1 | Version 1 |
| TIMESTAMP | 2017-05-11T21:14:15.003Z | Message created on 11 May 2017 at 09:14:15 pm, 3 milliseconds into the next second |
| HOSTNAME | mymachine.example.com | Message originated from host "mymachine.example.com" |
| APP-NAME | su | App-Name: "su" |
| PROCID | - | PROCID unknown |
| MSGID | ID47 | Message-ID: 47 |
| STRUCTURED-DATA | [exampleSDID@32473 iut="3" eventSource=" eventID="1011"] | Structured Data Element with a non-IANA controlled SD-ID of type "exampleSDID@32473", which has three parameters |
| MSG | BOMAn application log entry... | BOM indicates UTF-8 encoding, the message itself is "An application log entry..." |
The Syslog Server
The Syslog Server is also known as the syslog collector or receiver.
Syslog messages are sent from the generating device to the collector. The IP address of the destination syslog server must be configured on the device itself, either by command-line or via a conf file. Once configured, all syslog data will be sent to that server. There is no mechanism within the syslog protocol for a different server to request syslog data.
While most Unix implementations and network vendors, like Cisco, have their own barebones syslog collectors, there are several others available as well.
Paessler’s PRTG monitoring software offers a built-in Syslog Receiver Sensor. The receiver collects all Syslog messages delivered. To use the function, the administrator needs to add the Syslog Receiver and then configure the IP address of that server as the destination server for syslog data on all devices to be monitored.
Once gathered, the dashboard shows:
- The number of received syslog messages per second.
- The number of messages categorized as “warning” per second.
- The number of messages categorized as “error” per second.
- The number of dropped packets per second.
The syslog protocol can generate a lot of messages. Syslog simply forwards messages as quickly as it generates them. As a result, the most important ability for a syslog server is the ability to properly filter and react to incoming syslog data.
The PRTG Syslog Receiver Sensor offers the ability to set filtering rules. These rules allow syslog messages to be included or excluded as warnings or errors, regardless of how they were originally generated on the device. This filtering ensures that administrators get notified about all the errors they want to know about without being overwhelmed by less important errors.
The syslog protocol offers no security mechanism. There is no authentication built-in to ensure that messages are coming from the device claiming to be sending them. There is no encryption to conceal what information is being sent to the server. It is particularly susceptible to so-called “playback attacks” where an attacker generates a previous stream of warnings to illicit a response.
Device Configuration
Most syslog implementations are configurable with respect to which facilities and which severity numbers will generate syslog events that are forwarded to the syslog server. It is important to configure this properly to avoid flooding the server (and the network) with unnecessary traffic. For example, Debug should never be set to send messages except during testing.
It is advisable to set the syslog parameters to require the highest possible (lowest numbered) facility and severity to minimize traffic. While a router error might indicate that an interface is down and thus definitely needs to be reported, a less important network printer might be configured to only generate syslog traffic for critical events.
Windows
Windows systems do not implement syslog within the standard Event Log system. The events generated within the Windows logging system can be gathered and forwarded to a syslog server using third-party utilities. These utilities monitor the Event Log, use the information to create a syslog formatted event, and forward the events using the standard syslog protocol.
Limitations
One major limitation of the syslog protocol is that the device being monitoring must be up and running and connected to the network to generate and send a syslog event. A critical error from the kernel facility may never send an error at all as the system goes offline. In other words, syslog is not a good way to monitor the up and down status of devices.
While syslog is not a good way to monitor the status of networked devices, it can be a good way to monitor the overall health of network equipment. While network monitoring software like PRTG offers a suite of utilities to watch over a network, nothing tells an administrator that there is a problem faster than an event log filling up with warnings. Properly configured syslog monitoring will detect the sudden increase in event volume and severity, possibly providing notice before a user-detectable problem occurs.
Security/Authorization/Auditing
The average corporate network contains numerous devices that no one should be trying to gain access to on an average day. If a remote switch that only gets logged into once per audit cycle suddenly has daily login attempts (successful or otherwise), it bears checking out. On these types of devices, syslog can be set to forward authentication events to a syslog server, without the overhead of having to install and configure a full monitoring agent.
Syslog also provides a way to ensure that critical events are logged and stored off the original server. An attacker’s first effort after compromising a system is to cover the tracks left in the log. Events forwarded via syslog will be out of reach.
Application Monitoring
There are plenty of ways to monitor how an application is running on a server. However, those monitors can overlook how the application is affecting other processes on the server. While high CPU or memory utilization is easy enough to detect with other monitors, logged events can help show more possible issues. Is an application continuously trying to access a file that is locked? Is there an attempted database write generating an error? Events like these may go undetected when caused by applications that do a good job of working around errors, but they shouldn’t be ignored. Syslog will make sure those logged events get the attention they deserve.
Syslog as Part of Overall Network Monitoring
Complete network monitoring requires using multiple tools. Syslog is an important pillar in network monitoring because it ensures that events occurring without a dramatic effect do not fall through the cracks. Best practice is to use a software that combines all the tools to always have an overview of what is happening in the network.


0 comments:
Post a Comment